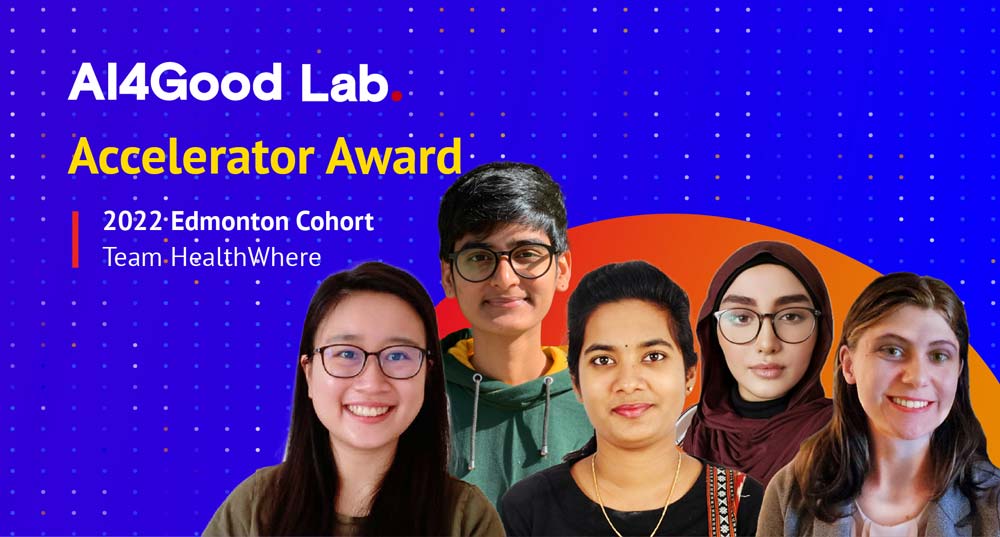
Team members
Kim Ngan Hoang, Pujitha Macha, Sai Gouthami Priyanka Raparthi, Alina Noor, Kathryn Gabriel
Project summary
HealthWhere decodes healthcare access across Canada using maps pointing to locations of various healthcare facilities across Canada.
Keywords
Healthcare access, Canada, machine learning, semi-supervised learning, cluster mapping, gaussian mixture model, data accessibility, maps, social good
Introduction
More and more Canadians do not have access to family doctors. When large portions of the population rely on busy walk-in clinics for day-to-day healthcare needs, chronic conditions or illnesses difficult to diagnose such as cancer can be easier to miss. In turn, when walk-in appointments at local clinics are fully booked by high demand, it magnifies the strain on an already overworked urgent care system that must handle the overflow. Finally, many Canadian residents forgo seeking healthcare at all.
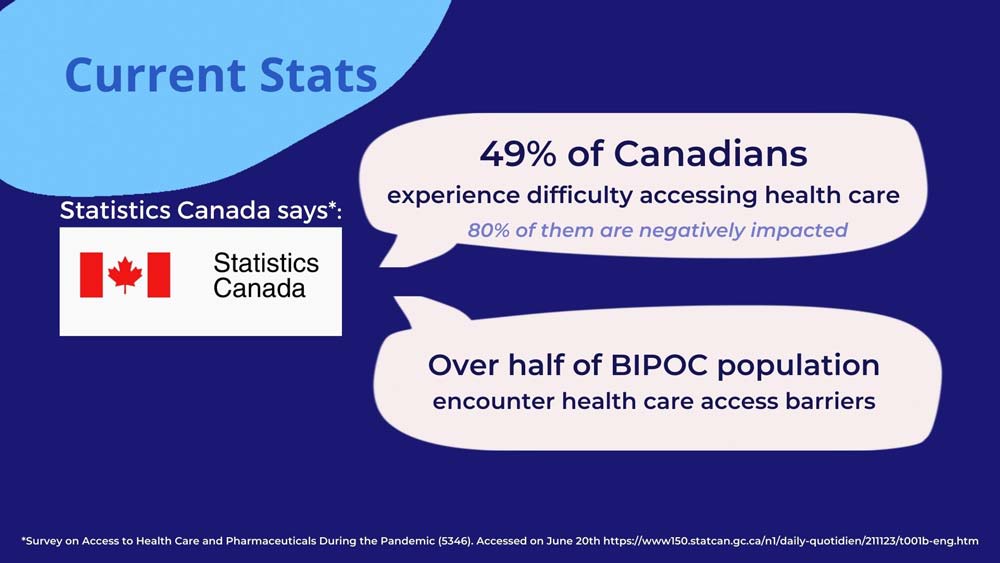
Healthcare access in Canada is difficult. With resources such as medical specialists and hospital capacity spread across various healthcare regions, it can be hard even for medical professionals to understand.
Furthermore, healthcare access disparities disproportionately impact people of color, women, low-income people, and people with disabilities. The quality of our healthcare system affects everyone, and its failures are felt even harder by marginalized groups.
The healthcare need in many areas is greater than the regional capacity to find care. But this is a big picture and highly nuanced problem. Data visualization and machine learning are both powerful tools that can be used to find emergent patterns and provide insights.
Our goal
HealthWhere leverages machine learning models to understand healthcare access in Canada and create insightful, map-based visualization tools. With these visualizations, patterns in healthcare access disparity emerge.
HealthWhere visualizations provide insights into healthcare access patterns as well as help the viewer understand the magnitude of unmet healthcare needs. Future models will use a composite score, modeled after the universal health coverage index used by the World Health Organization, to assess how well each Canadian healthcare region meets its population’s needs and identify how adding healthcare resources to a region will affect that region’s score.
How does HealthWhere work?
HealthWhere addresses health care access disparities by visualizing healthcare facilities and services across different regions in Canada in order to provide individuals with a better understanding and access to their local services.
Datasets used
Several aspects of healthcare access were considered in consultation with two medical doctors (Dr. Ann Crabtree and Dr. Courtney Handford) and in accordance with several healthcare accessibility assessment frameworks such as the universal health coverage — service capacity and access category outlined by the World Health Organization (WHO). Ultimately, we curated data using the wait time for priority procedures, the number of hospital beds staffed and in operation per population with perceived low health, and the number of physicians per population datasets from the Canadian Institute for Health Information (CIHI) and Statistics Canada. For our maps, we curated geospatial data using the health region geographic boundaries and the open database of healthcare facilities from Statistics Canada.
Technologies used
For the Machine Learning component, Gaussian Mixture Models (GMM) were trained to produce clusters of similarities in healthcare access across different regions. After our GMM model is trained, we plotted and analyzed the results of the clustering so that we could determine what each cluster means. The analysis results on the clusters were visualized on a map with labels of data specific to each healthcare region. The maps are converted into HTML for the web application. We used Figma to create our web app mockups where we would display our maps as well as detailed explanations of our models and interpretation of the results.

Functionality
Once the user opens up the maps, they can see a visualization of the healthcare facilities and services based on region, which they can zoom in and out of to get specific or general information. The user can click on a region which would prompt a pop-up displaying the healthcare region’s data used in our model as well as its probability of belonging to each GMM-generated group. This is to ensure data and model transparency and interpretability.
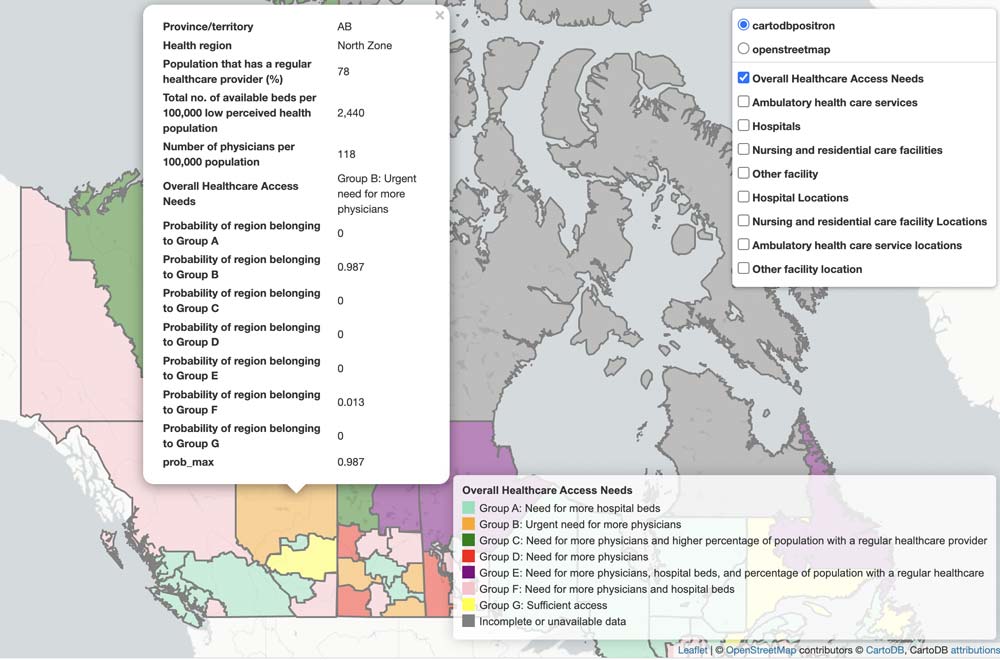
The user can also customize their map view and learn more about healthcare facilities’ service type, location, and regional density. Visit https://healthwhereai.github.io/OverallHealthcareAccessMap or https://healthwhereai.github.io/MentalHealthcareAccessMap to learn more about our product.
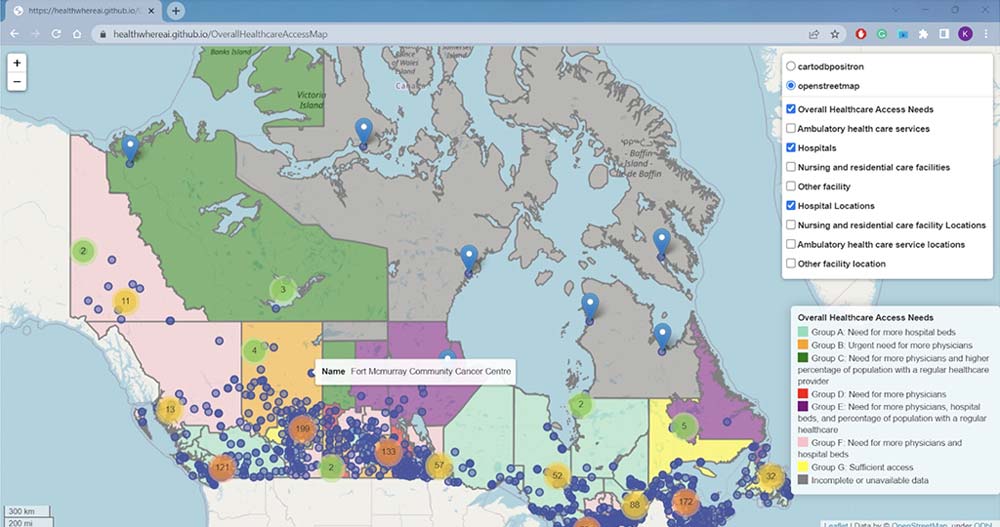
HealthWhere is a good Machine Learning use case because the issue of clustering data based on specified features can be resolved by training a Machine Learning model of interest. Additionally, the impact of these results benefits a large group of individuals and communities along with having the potential to effectively provide information on improving and building access to services and facilities within communities. To add to that, the data on services and facilities within regions across Canada are available for this type of analysis.
Our impact model
HealthWhere was created in consultation with experts. We have achieved an MVP (minimum viable product). To our best knowledge, no other accessible view of healthcare access in Canada currently exists. We aim to impact the landscape of healthcare access by addressing its issues and updating the outlook of healthcare access information. Policymakers can use HealthWhere to visualize healthcare disparities and make data-driven decisions. And on an individual level, our map promotes awareness about healthcare realities in Canada, allowing individuals to contact local policymakers about their concerns. Throughout our process, we value data transparency and interpretability. These values matter even more when healthcare data is involved. HealthWhere’s focus is to combat this and increase the overall transparency of healthcare information throughout Canada.
Our challenges
The biggest challenge was the datasets we had to deal with for the healthcare analysis. Many datasets show how the healthcare sector functions in Canada, but we require a lot of domain knowledge to interpret and understand the story they are trying to tell. Most of the datasets include archival information from more than a decade ago. Hence cleaning the data was also a challenge. But we enjoyed it as we believed data is the project's foundation. The datasets we chose were diverse and contained a wide variety of categories; hence it was tough to relate them together, to form a combined dataset for the overall analysis. Deciding on how to model the problem — as either a supervised or unsupervised problem was not clear to us initially, as a pool of ideas went above our head after we saw our final dataset. All these challenges were resolved by collaborating with our mentors, primarily our TA Paige Tuttosi. She was helpful in relating our problem to her experience and guided us to find solutions that could be implemented. The experts, Dr. Ann Crabtree and Dr. Courtney Handford, were also of great assistance, providing us with suggestions and guidance on how to understand the data and gain insights that helped us design our final solution for the identified problem.
Lessons learned from AI4Good Lab
We are proud because we had the opportunity to meet and collaborate with many experts across Canada who are making tremendous contributions to the AI space. During the Lab, we learned how to think out of the box for a given task, interpret the solutions designed, and decide if they are sustainable. Also, the Lab conducted many workshops on managing project flow, thinking about various corners of the problem, and, most importantly, the technical and domain knowledge required for implementing machine learning solutions. We understood how collaboration and diverse skills could bring beautiful outcomes during development. All our teammates possess various skills ranging from frontend to backend, which helped us design a visually appealing solution that also has a robust backend that could drive data to the user. We are proud that we could learn ML and implement a solution that can be used for social good and benefit society. Our biggest accomplishment is the Edmonton’s Accelerator Award, as it is not just an award. It is a boost of encouragement for all the team members and, most importantly, our recognition of the hard work we put into this project.
Future directions
Here are our next steps. Synthesizing new data to our models will first help us achieve even better insights. We hope to use our Gaussian Mixture Model to predict how changing features in a region will improve or worsen healthcare access. We would like a responsive web application that serves as a one-stop solution for all healthcare needs information.
Some of our longer-term goals include generating insights for more specific healthcare types (so far we have psychiatric care but we would also like to include others). Finally, one day we will explore datasets to analyze healthcare access outside Canada.
Acknowledgements
We would like to thank mentors Paige Tuttosi, Dr. Courtney Handford, Dr. Ann Crabtree, Jia Song, and Kelly Zheng for their valuable input and mentorship throughout the journey. We would also like to acknowledge AI4Good Lab for the opportunity to learn and develop our project and for their continued support and guidance.